
I recently saw a question about how to design complex functionalities with fpgas on reddit. There were many good answers but there are not that many step by step practical examples on how one might get around going through a complex design. So I thought it would be fun to design something that takes a bit of design effort and write down each step as I go along. The example developed here is an lcd driver that plots measurement data from adc to a tft lcr screen. The sources are available on github. The tests for the lcd image driver are found in its own repository which is included in the project as a git submodule.
My initial plan is to first create a pixel image of similar size to the lcd screen in python using 2d matrix of pixels. Then we modify it to take a similar data stream to what the lcd runs on. This data is then read from a file and after this the file is written from testbench written in vhdl with pixels formed with synthesizable code. Lastly we compile the code to Efinix Titanium evaluation kit and test it by streaming the data through uart to computer and and plot the image with python. The uart stream which has the same pixel information with which the lcd screen will be driven eventually.
This is a part 1, in which I go through the image creation and in part 2 we will configure the SPI and write the image data to the display. The lcd was modeled in a lcd python module and this model was used plot images created the VHDL testbenches.
Design complexity
There are a few reasons for what makes this design complex. For starters we do not have an obvious way to plot data from vhdl directly. The plotted data needs to be buffered to ram and we need configure lcd from SPI as well as create the picture from the data buffered in ram and scale the data to correct form for plotting. Thus the complexity comes from multiple interfaces that we need create, test and use and have them work together. Complex does not necessarily mean difficult, but complexity does require management or it makes things difficult.
Manage complexity
The easiest approach to manage complexity in designs is by making design progress small individual steps and checking them continuously along the way. Making these steps can be done by creating tests and running them continuously as we develop the code. By continuous I mean every time we edit the code so something close to every few minutes or so of writing code.
We should also keep all tests in separate files and store them in the Git repository along with the source code. We can think of keeping these tests as constructing a scaffolding or attaching climbing anchors. Having these tests allow us to retrace our steps and if we find out that we went wrong at some point, we can go back and try again starting from a known good point in the design. Also importantly we can go back to clean and refine our design once it has been written and continuously verify that we have not broken anything.
How to run the tests
The repository has a really crude powerhshell script to run all testbenches and to plot all figures. Note that the powershell script is assumed to be run from the root of the lcd git repository
cd temp
python ../vunit_run_lcd.py -p 16

cd ../python_lcd_tests
start python plot_lcd_driver_tb.py
start python plot_lcd_driver_w_bus_tb.py
start python plot_multiple_datas.py
start python plot_write_sine_to_file_tb.py
start python test_streaming_from_file.py
cd ..
To run the tests referred in this post, you need VUnit and GHDL. For windows the easiest way to get ghdl is via MSYS2 package manager and VUnit can be installed using python package manager like pip. The only configuration you need is an environment variable VUNIT_SIMULATOR with value ghdl.
To run the vunit script, run the vunit_run_lcd.py from the temp folder using python ../vunit_run_lcd.py -p 16. The python plot scripts to plot the pixel images after running the vunit_run_lcd.py script can be found in the python_lcd_tests folder
LCD screen interface

To start the design, we first take a look at the lcd display. The display in question is a very cheap lcd screen available from aliexpress. The display has a wiki page which can be found here. I am using the 3.5 inch 480×320 pixel display with a 4 wire spi interface and touch controls. The pixel format 16 bit rgb with r = 5bit, b = 6 and g = 5bit and the frame is visualized below. The numbers refer to the indices of the first and last bits in of a color in a pixel and the image is transmitted to the lcd in one continuous stream of bits.

The pixels are mapped onto the display in the the following way, left to right and one row at a time

What we need to do now is to plot some figures in a way that is as simple as possible and that captures some of the behavior of the lcd.
Getting started : Plotting a pixel image
After quick googling with words “pixel” “image” and “python”, I found this blog post by Kalsoom Bibi with a 7 line snippet to create an image from pixels by using Python matplotlib imshow() method. With a bit of modification the following module allows plotting pixels directly with just a few lines of code with an image that has the same size and quantity of pixels as the lcd screen.
from matplotlib import pyplot as plt
import numpy as np

class lcd:
    def __init__(self, xsize, ysize):
        self.xsize = xsize
        self.ysize = ysize

    def lcdprint(self, data_in):
        scale = 1.25/2.54 #iterated to roughly correct size
        plt.rcParams["figure.figsize"] = [7.344*scale, 4.896*scale]
        plt.rcParams["figure.autolayout"] = True
        plt.imshow(data_in, origin='upper')
        plt.show()
The numbers 7.344 and 4.896 are the screen width and height in millimeters taken from the datasheet. These are then scaled with a magic number, or “experimental scale factor” to make the picture appear in the computer display similar enough to the actual lcd display. Scale factor was iterated by holding the screen close to the figure on the pc monitor and checking that the vertical draw area aligns to the size of the python image. This is shown in Figure 3 below.
The actual plotting simply needs some test data to be created and then calling the lcdprint with this test data.
#test_lcd_plotter.py
from lcd_plotter import *
xsize = 480
ysize = 320
lcd_plotter = lcd(xsize,ysize)

d = np.random.rand(ysize, xsize)
lcd_plotter.lcdprint(d)
Running this test results in the random noise plotted on a 480×320 pixel matrix as shown here

Now we can create a pixel image that models the actual lcd screen. The next thing to do is to figure out how to plot a sine to the pixel image from an array of measurement values.
Plotting a sine wave
To easily plot some measurement data from an adc, we assume that the input is a vector of 480 measurement points. This way index of the array corresponds with the x axis values of the lcd screen and the data in the array corresponds with the y axis value.
The image is set on the screen such that the pixel positions are from 0 to 479 and 0 to 319 for x and y directions. This is visualized in the sketch below

This means that for range of [-1, 1] set of numbers we want to map 0 to the center line of the screen. Hence we need to add an offset of y-length/2 to the measurement vector and multiply the amplitudes with the height of our screen, in this case 320/2. Since the zeroth position of the screen is at to top left corner, we need flip the figure around. To flip the y-axis position the pixel value is plotted by subtracting the value from ymax of 319.
    def flip_y_axis(self, data_in, scale):
        return  self.ysize - np.round(data_in * self.ysize/2 * scale + self.ysize/2)
The way we map the sine wave onto a pixel image is by for looping through the pixels of the image and set a value to 1 if the measurement vector at point corresponding to the pixels x axis value has a number that corresponds to the y axis value.
    def add_plot(self, figure, input_buffer):
        for y in range(self.ysize):
            for x in range(self.xsize):
                if y == input_buffer[x]:
                    figure[y,x] = 1.0

        return figure
The test script creates a sine which is then scaled to the screen
#plot_data.py
from lcd_plotter import lcd
import numpy as np

xsize = 480
ysize = 320

lcd_plotter = lcd(xsize,ysize)

data  = lcd_plotter.flip_y_axis(np.sin(np.linspace(0 , 3  * np.pi , xsize)) , 0.9)

d = np.zeros([ysize,xsize])
d = lcd_plotter.add_plot(d, data)
lcd_plotter.lcdprint(d)
Running this script creates a pixel image of similar size and number of pixels as the lcd screen

The plot function only changes the corresponding pixels and we can easily plot multiple traces on the same screen which is done in the
#plot_multiple_datas.py
from lcd_plotter import lcd
import numpy as np

xsize = 480
ysize = 320

lcd_plotter = lcd(xsize,ysize)

data  = lcd_plotter.flip_y_axis(np.sin(np.linspace(0 , 3  * np.pi , xsize)) , 0.9)
data2 = lcd_plotter.flip_y_axis(np.sin(np.linspace(0 , 9  * np.pi , xsize)) , 0.3)
data3 = lcd_plotter.flip_y_axis(np.sin(np.linspace(0 , 15 * np.pi , xsize)) , 0.1)
data4 = lcd_plotter.flip_y_axis(np.sin(np.linspace(0 , 21 * np.pi , xsize)) , 0.05)

d = np.zeros([ysize,xsize])
d = lcd_plotter.add_plot(d, data)
d = lcd_plotter.add_plot(d, data2)
d = lcd_plotter.add_plot(d, data3)
d = lcd_plotter.add_plot(d, data4)
d = lcd_plotter.add_plot(d, data+data2+data3+data4-round(3*ysize/2))

lcd_plotter.lcdprint(d)

Now this very simple python code behaves approximately like the lcd screen. Next we will output the pixel image vector from a vhdl module.
Writing plotted data from vhdl
The simplest way to get data from a vhdl module to python is by writing data to file from vhdl testbench and this file is then read by the python module. To write a file in vhdl we create a file handle and then just use std.write() to write a line to buffer and std.writeline() to write it to file.
In the first test we write the 480 measurement values to a file from a vhdl testbench and we use the python to create the image from this files datastream.
 --snip from write_sine_to_file_tb.vhd
    stimulus : process(simulator_clock)

        file f : text open write_mode is "write_sine_to_file_tb.txt";
        variable row : line;

    begin
        if rising_edge(simulator_clock) then
            simulation_counter <= simulation_counter + 1;
            write(row , integer(round(sin(real(simulation_counter)/480.0*15.0*math_pi)*160.0*0.9+160.0)));
            writeline(f , row);
        end if; -- rising_edge
    end process stimulus;
To get pixel data from a file into the python code, numpy library has a method called loadtxt() which reads the file that we have written from VHDL testbench.
#plot_write_sine_to_file_tb.py
from lcd_plotter import lcd
import numpy as np

xsize = 480
ysize = 320

lcd_plotter = lcd(xsize,ysize)

d = np.zeros([ysize,xsize])
data_from_vhdl = np.loadtxt("../temp/write_sine_to_file_tb.txt")
d = lcd_plotter.add_plot(d, data_from_vhdl)

lcd_plotter.stream_lcd(d)
Running the script gets us a plot of a sine that has values written from the vhdl testbench

With our data written from VHDL now available in the python script, next we will create the entire figure with VHDL.
Create Pixel image from vhdl
VHDL runs in parallel as opposed to one step at a time like Python. Because of this parallel nature, we need to specifically write the order of operations into our VHDL code. How this is seen in the VHDL implementation is that we cannot just for loop through all of the pixels as that would actually process the entire figure in in one step.
To go through pixels one at a time we need to have cascaded counters. Counters are a simple way that allows the VHDL code to go through the x and y positions in a sequence. We will create a pixel position counter module for tracking the pixel values. From this module we can request the starting counting and it tells when the count is finished as well as returns the updated x and y positions.
package pixel_position_counter_pkg is

    type intarray is array (integer range 0 to 479) of integer;
    function init_intarray return intarray;

    type pixel_position_counter_record is record
        xpos : integer range 0 to xmax;
        ypos : integer range 0 to ymax;
        is_requested : boolean;
        is_updated : boolean;
        is_ready : boolean;
    end record;
The interface to the pixel_position_counter consists of a record of modules name, a create_pixel_counter procedure that builds the actual logic and functions to get both x and y values, to check when a pixel is ready as well as a function to tell when all pixels have been counted. The module is operation is requested with a procedure which starts the counters.
    procedure create_pixel_position_counter
    (
        signal self : inout pixel_position_counter_record
    ) is
    begin
        if not ((self.xpos = xmax) and (self.ypos = ymax)) or self.is_requested then
            self.is_updated <= true;
            if self.xpos = xmax then
                procedure_increment_and_wrap(self.ypos, ymax);
            end if;
            procedure_increment_and_wrap(self.xpos, xmax);
            if self.ypos = ymax and self.xpos = xmax-1 then
                self.is_ready <= true;
            end if;
        end if;
    end create_pixel_position_counter;

------------------------------------------------------------------------

    procedure request_pixel_counter
    (
        signal self : out pixel_position_counter_record
    ) is
    begin
        self.is_requested <= true;
    end request_pixel_counter;
To test the pixel position counter module, we make a testbench that creates the position counter and uses interface functions to write the individual pixels onto a file. The pixel_position_counter is only used through the subroutines which makes it easy to connect it to the testbench.
In the testbench the named functions and procedures also give us far more insight into what is being done when compared to the actual implementation of those subroutines. For example the transmit_pixel -procedure models the way we would like to use the SPI, that is we want to call a procedure when a pixel position is calculated.
    stimulus : process(simulator_clock)

        file f : text open write_mode is "pixel_position_counter_tb.txt";
        ------------------------------------------------------------------------
        procedure transmit_pixel
        (
            file file_handle : text;
            pixel : in integer
        ) is
            variable row : line;
        begin
            write(row , pixel);
            writeline(file_handle , row);
        end transmit_pixel;
        ------------------------------------------------------------------------

        variable pixel_value : integer;

    begin
        if rising_edge(simulator_clock) then
            simulation_counter <= simulation_counter + 1;

            create_pixel_position_counter(pixel_position_counter);

            if pixel_position_is_updated(pixel_position_counter) then
                if get_y(pixel_position_counter) = sinearray(get_x(pixel_position_counter)) then
                    pixel_value := 1;
                else
                    pixel_value := 0;
                end if;
                transmit_pixel(f,pixel_value);
            end if;

            -- test signals
            if simulation_counter = 15 then
                request_pixel_counter(pixel_position_counter);
            end if;
The testbench writes pixel_image_stream_from_vhdl.txt file which has a row of 320*480 = 153600 ones and zeros that are then read with a python script. We can easily form a 2d pixel matrix from the vector with a numpy resize() method that takes in a vector and resizes it into a matrix. We add a method for the lcd module which resizes the vector to a matrix and plots the figure
    def stream_lcd(self, data_in):
        self.lcdprint(np.resize(data_in,[self.ysize, self.xsize]))
The script that read in the file with data written by the VHDL testbench is shown below
#plot_pixel_position_counter_tb.py
from lcd_plotter import *
import numpy as np

xsize = 480
ysize = 320

lcd_plotter = lcd(xsize,ysize)


d = np.zeros([ysize,xsize])
data_from_vhdl = np.loadtxt("../temp/pixel_position_counter_tb.txt")
lcd_plotter.stream_lcd(data_from_vhdl)
Running this file plots the image now built entirely from a VHDL module. Next we start adding in the lcd interface
LCD module interface
The LCD driver is put into its own entity. This is because the simulation needs to output the pixel image to a file and the real hardware is going to transmit it serially through spi. The different implementation are managed with having separate entities for the different implementations. To prevent duplicating code we are going to use the same interface defined by the lcd_driver input and output record type signals that form the interface of the entity. These records are used with the procedures setup_lcd_driver and transmit_pixel as well as a function that tells when a pixel has been transmitted.
package lcd_driver_pkg is

    type lcd_driver_input_record is record
        pixel_to_be_written : integer;
        write_is_requested : boolean;
    end record;

    constant init_lcd_driver : lcd_driver_input_record := (0, false);

    procedure setup_lcd_driver (
        signal self : out lcd_driver_input_record);

    procedure transmit_pixel (
        signal self : out lcd_driver_input_record;
        pixel : in integer);
--------------------------------------------------
--------------------------------------------------
    type lcd_driver_output_record is record
        pixel_has_been_written : boolean;
    end record;

    constant init_lcd_driver_out : lcd_driver_output_record := (pixel_has_been_written => false);

    function lcd_driver_is_ready ( self : lcd_driver_output_record)
        return boolean;
The lcd_driver module can be found here. The lcd_driver has a single process that writes the text file and it gets the pixel values from the port of the entity and tells that a pixel has been transmitted by assigning the lcd_driver_out.pixel_has_been_written with value “true”.
    drive_a_pixel : process(clock)
        use std.textio.all;

        file f : text open write_mode is "pixel_image_stream_from_lcd_driver.txt";
        ------------------------------------------------------------------------
        procedure transmit_pixel
        (
            file file_handle : text;
            pixel : in integer
        ) is
            variable row : line;
        begin
            write(row , pixel);
            writeline(file_handle , row);
        end transmit_pixel;
        ------------------------------------------------------------------------

    begin
        if rising_edge(clock) then
            lcd_driver_out.pixel_has_been_written <= false;
            if lcd_driver_in.write_is_requested then
                transmit_pixel(f,lcd_driver_in.pixel_to_be_written);
                delay_counter <= 4;
            end if;

            if delay_counter > 0 then
                delay_counter <= delay_counter - 1;
            end if;

            if delay_counter = 1 then
                lcd_driver_out.pixel_has_been_written <= true;
            end if;
        end if; --rising_edge
    end process drive_a_pixel;
adding backpressure to pixel position counter
Although it might have seemed unnecessary to write an entire module for the pixel counter before, as the pixel is counted always in one clock cycle, we now need to use it with another interface which takes some undefined amount of time to process the pixel. Because of this the pixel position needs to be updated when the lcd driver has transmitted a pixel instead of a subsequent clock cycle. The ability for modules to throttle the inputs is commonly known as backpressure.
The way we achieve this is by moving the position update functionality from the create_pixel_counter into its own procedure. We then create a new version of the create_pixel_position_counter procedure. So now one version of the create procedure takes in a boolean value to trigger the pixel position update and another which just sets this value to always true.
    procedure update_position
    (
        signal self : inout pixel_position_counter_record
    ) is
    begin
        if not ((self.xpos = xmax) and (self.ypos = ymax)) or self.is_requested then
            self.is_updated <= true;
            if self.xpos = xmax then
                procedure_increment_and_wrap(self.ypos, ymax);
            end if;
            procedure_increment_and_wrap(self.xpos, xmax);
            if self.ypos = ymax and self.xpos = xmax-1 then
                self.is_ready <= true;
            end if;
        end if;
    end update_position;

------------------------------------------------------------------------
    -- new procedure with external 'calculate' command
    procedure create_pixel_position_counter
    (
        signal self : inout pixel_position_counter_record;
        calculate : boolean
    ) is
    begin
        init_flags(self);
        if self.is_requested or calculate then
            update_position(self);
        end if;
    end create_pixel_position_counter;

    -----
    -- old procedure with same operation as before, which just calls the new procedure
    procedure create_pixel_position_counter
    (
        signal self : inout pixel_position_counter_record
    ) is
    begin
        create_pixel_position_counter(self, true);

    end create_pixel_position_counter;
Note that we did not break the old interface, we just amended the module with a new functionality. Hence we also did not need to break the previously written test as now our original test implements this new interface with just a constant boolean value. We have also managed to reuse the previous test as the old version of the procedure calls the newly made one.
With this functionality we do not need to know when a pixel is ready, instead we can just poll the ready function and transmit a new pixel every time a pixel transmission is ready. The way we do this is that we connect the pixel_transmission_is_ready function to the pixel counter calculate variable that just created and it allows the pixel_position_counter and the lcd_driver to time themselves.
Testing pixel_position_counter
In the testbench below, we can see that the create_pixel_position_counter module interface has the lcd_driver_is_ready() function call in argument. This is used to trigger the next position update from the event that the lcd driver is ready. The test implementation has a simple counter for each individual ready flag, but the main feature is that now we can have configurable number of delays between each pixel and the update is triggered from the lcd driver module.
------------------------------------------------------------------------
    stimulus : process(simulator_clock)
    begin
        if rising_edge(simulator_clock) then
            create_pixel_position_counter(pixel_position_counter, lcd_driver_is_ready(lcd_driver_out));
            setup_lcd_driver(lcd_driver_in);

            if pixel_position_is_updated(pixel_position_counter) then
                if get_y(pixel_position_counter) = sinearray(get_x(pixel_position_counter)) then
                    transmit_pixel(lcd_driver_in, 1);
                else
                    transmit_pixel(lcd_driver_in, 0);
                end if;
            end if;

            ------------------------------
            -- simulator configuration
            ------------------------------
            simulation_counter <= simulation_counter + 1;
            if get_x(pixel_position_counter) = 0 and get_y(pixel_position_counter) = 0 then
                has_run <= true;
            end if;

            if figure_is_ready(pixel_position_counter) then
                has_finished <= figure_is_ready(pixel_position_counter);
            end if;

            if simulation_counter = 15 then
                request_pixel_counter(pixel_position_counter);
            end if;
            ------------------------------
        end if; -- rising_edge
    end process stimulus;

------------------------------------------------------------------------
    u_lcr_driver : entity work.lcd_driver
    generic map(latency_in_clock_cycles => 4)
    port map(simulator_clock, lcd_driver_in, lcd_driver_out);
We again test this module by plotting the sine wave from the generated data, now with the data being written from the LCD driver vhdl module. The lcd driver has an implementation which is simply the previously used text write
architecture write_to_file of lcd_driver is

    signal delay_counter : integer range 0 to 7 := 0;


begin

    drive_a_pixel : process(clock)
        use std.textio.all;

        file f : text open write_mode is "pixel_image_stream_from_lcd_driver.txt";
        ------------------------------------------------------------------------
        procedure transmit_pixel
        (
            file file_handle : text;
            pixel : in integer
        ) is
            variable row : line;
        begin
            write(row , pixel);
            writeline(file_handle , row);
        end transmit_pixel;
        ------------------------------------------------------------------------

    begin
        if rising_edge(clock) then
            lcd_driver_out.pixel_has_been_written <= false;
            if lcd_driver_in.write_is_requested then
                transmit_pixel(f,lcd_driver_in.pixel_to_be_written);
                delay_counter <= 4;
            end if;

            if delay_counter > 0 then
                delay_counter <= delay_counter - 1;
            end if;

            if delay_counter = 1 then
                lcd_driver_out.pixel_has_been_written <= true;
            end if;
        end if; --rising_edge
    end process drive_a_pixel;


end write_to_file;
The image written from this LCD driver module can be plotted using the python script.
Plotting pixel values from ram with pixel_image_plotter
The previous test just used an array of the pixel values directly, but for fpga implementation, we want to use ram to store the measurement values. This functionality is written in a new module called pixel_image_plotter. This module consists of a record that has the ram read and write ports as well as the pixel_position counter shown before.
package pixel_image_plotter_pkg is


    type pixel_image_plotter_record is record
        pixel_position_counter : pixel_position_counter_record;
        read_port              : ram_read_port_record;
        ram_write_port         : ram_write_port_record;
    end record;

    constant init_pixel_image_plotter : pixel_image_plotter_record := (
         init_pixel_position_counter,
         init_ram_read_port, init_ram_write_port);

    procedure create_pixel_image_plotter (
        signal self : inout pixel_image_plotter_record;
        signal lcd_driver_in : out lcd_driver_input_record;
        lcd_driver_out : in lcd_driver_output_record);

    procedure request_image ( signal self : inout pixel_image_plotter_record);

end package pixel_image_plotter_pkg;
The implementation of the pixel image plotter is the contents of the previously used testbenches, with the difference that it now additionally drives ram. The image creation is triggered with “request_image” procedure that calls the ram and starts the pixel counter.
The ram read is triggered from the pixel_image_plotter. When pixel_position_is_updated() we read the contents of the ram and compare the y values and we trigger the next ram read based on the pixel x position. We also transmit the pixel value to the lcd driver. The lcd_driver interface is given to the pixel_image_plotter through the the argument list of the create_pixel_image_plotter procedure call which allows it to have access to the interface from the lcd_driver_pkg.
We cannot add the port of an entity as part of the pixel_image_plotter_record. This is because the create_procedure gets the module record signal with inout access and ports need to be either in or out only. The lcd_driver would be possible to be part of the pixel_image_plotter_record using interfaces from vhdl2019, but these are not yet supported by synthesis tools.
package body pixel_image_plotter_pkg is

------------------------------------------------------------------------
    procedure create_pixel_image_plotter
    (
        signal self : inout pixel_image_plotter_record;
        signal lcd_driver_in : out lcd_driver_input_record;
        lcd_driver_out : in lcd_driver_output_record
    ) is
    begin
        create_pixel_position_counter(self.pixel_position_counter, lcd_driver_is_ready(lcd_driver_out));
        setup_lcd_driver(lcd_driver_in);

        create_ram_read_port(self.read_port);
        create_ram_write_port(self.ram_write_port);

        if pixel_position_is_updated(self.pixel_position_counter) then
            if get_x(self.pixel_position_counter)+1 < x_max then
                request_data_from_ram(self.read_port, get_x(self.pixel_position_counter)+1);
            else
                request_data_from_ram(self.read_port, 0);
            end if;
            if get_y(self.pixel_position_counter) = get_ram_data(self.read_port) then
                transmit_pixel(lcd_driver_in, 1);
            else
                transmit_pixel(lcd_driver_in, 0);
            end if;
        end if;

    end create_pixel_image_plotter;

------------------------------------------------------------------------
    procedure request_image
    (
        signal self : inout pixel_image_plotter_record
    ) is
    begin
        request_pixel_counter(self.pixel_position_counter);
        request_data_from_ram(self.read_port, 319);
    end request_image;
------------------------------------------------------------------------

end package body pixel_image_plotter_pkg;
The testbench for the pixel_image_plotter can be found here.
In the pixel_image_plotter_tb we have moved the accesses to the ram array outside of the create_pixel_image_plotter procedure. This is because after testing with hardware, I noticed that Efinity does not implement a ram if these two if statements are inside a procedure call. The same behavior is in Xilinx Vivado.
This specific quirk is seen in the snip below
-- snip from pixel_image_potter_tb
           create_pixel_image_plotter(pixel_image_plotter, lcd_driver_in, lcd_driver_out);
            ------------------------------------------------------------------------
            if ram_read_is_requested(ram_read_port) then
                ram_read_port.read_buffer <= test_ram(get_ram_read_address(ram_read_port));
            end if;

            if write_to_ram_is_requested(ram_write_port) then
                test_ram(ram_write_port.write_address) <= ram_write_port.write_buffer;
            end if;
            ------------------------------------------------------------------------
Streaming image through uart
We want to test the image writing through uart before moving on to the display SPI. So next we create a test where we actually stream the pixel data through the internal bus of the FPGA which will then be connected to uart. We create a version of the lcd driver entity that gets the internal bus signals to its port and internally routes the pixel data to this bus. In the fpga this bus is connected to uart which allows us to stream the data through the uart and then plot the image from fpga.
This version of the entity uses the same interface which is defined in the lcd_driver_pkg as was used before, but it also has the in and out directional bus signals.
The process in the lcd_driver_w_bus module initializes the bus using init_bus procedure call. When the lcd_driver_in.write_is_requested, the process takes the inputted pixel value and writes_data_to_address zero. It also assings the delay counter with the value taken from the generic. When the counter has finished, the module drives lcd_driver_out.pixel_has_been_written with value “true”.
    use work.lcd_driver_pkg.all;
    use work.fpga_interconnect_pkg.all;

entity lcd_driver_w_bus is
    generic(delay_between_packets : integer := 4);
    port (
        clock : in std_logic;
        lcd_driver_in       : in lcd_driver_input_record;
        lcd_driver_out      : out lcd_driver_output_record ;
        bus_to_lcd_driver   : in fpga_interconnect_record;
        bus_from_lcd_driver : out fpga_interconnect_record
    );
end entity lcd_driver_w_bus;


architecture write_to_file of lcd_driver_w_bus is

    signal delay_counter : integer range 0 to 2**19-1 := 0;

begin

    drive_a_pixel : process(clock)
    begin
        if rising_edge(clock) then
            init_bus(bus_from_lcd_driver);

            lcd_driver_out.pixel_has_been_written <= false;
            if lcd_driver_in.write_is_requested then
                write_data_to_address(bus_from_lcd_driver, 0, lcd_driver_in.pixel_to_be_written);
                delay_counter <= delay_between_packets;
            end if;

            if delay_counter > 0 then
                delay_counter <= delay_counter - 1;
            end if;

            if delay_counter = 1 then
                lcd_driver_out.pixel_has_been_written <= true;
            end if;
        end if; --rising_edge
    end process drive_a_pixel;


end write_to_file;
The lcd driver with bus testbench implements a bus master which captures the transmitted pixel and writes it into a file
------------------------------------------------------------------------
    bus_master : process(simulator_clock)
        use std.textio.all;
        file f : text open write_mode is "pixel_image_stream_from_bus_lcd_driver.txt";
        ----------------------------------------------------------------------
        procedure transmit_pixel
        (
            file file_handle : text;
            pixel : in integer
        ) is
            variable row : line;
        begin
            write(row , pixel);
            writeline(file_handle , row);
        end transmit_pixel;
        ----------------------------------------------------------------------

    begin
        if rising_edge(simulator_clock) then
            init_bus(bus_from_stimulus);
            if write_from_bus_is_requested(bus_from_lcd_driver) then
                transmit_pixel(f,get_data(bus_from_lcd_driver));
            end if;

        end if; --rising_edge
    end process bus_master;
------------------------------------------------------------------------
    u_lcd_driver : entity work.lcd_driver_w_bus
    port map(simulator_clock, lcd_driver_in, lcd_driver_out, bus_from_stimulus, bus_from_lcd_driver);
------------------------------------------------------------------------
end vunit_simulation;
The testbench writes the figure to a file which is plotted with corresponding python script.

This pixel image plotter with the lcd_driver that also has the bus now has all of the functionality that we can test the image creation with fpga.
Testing pixel image creation with Efinix Titanium FPGA

The Efinix titanium evaluation kit has a ftdi4232 chip which has both jtag and uart on board. The uart is then used to communicate with a Efinix titanium fpga. I have written an uart, a simple protocol for uart and an internal bus earlier which are used here. An fpga communication module which has these is included as a submodule to the project. To use the uart protocol from pc the project also has uart module that is implemented in python and has methods for communicating using the uart protocol.
The simple protocol allows reading and writing registers based on address as well request for up to 1.6M 16 bit words to be streamed from the fpga. There are two methods for the stream, one where the communications module streams data out of the fpga as soon as a dataword has been transmitted and another which allows the owner of the source address to stream words when they are ready.
To test the pixel_image_plotter with fpga, we connect the request_image() procedure to address 10000 using the functions from the bus. This address request triggers the image formation from the pixel_image_plotter, which calls the lcd driver with the transmit_pixel. The lcd_driver writes data to the internal bus at address 0 which is connected to the uart protocol and which then transmits the pixel data with uart to pc.
Additionally the ram read port is connect to the internal bus directly and we map an arbitrary register 512 to request_data_from_ram() procedure call. When the register 512 is read the code additionally increments a read_address. This allows the ram to be read with a single uart stream in fifo like fashion. Additionally register 513 is connected to the read_address, which allows us to write the address to any location in order to begin streaming the ram contents from a known start address.
The process from top module is shown below
------------------------------------------------------------------------
test_communications : process(clock_120Mhz)
alias ram_read_port is pixel_image_plotter.read_port;
alias ram_write_port is pixel_image_plotter.ram_write_port;
begin
if rising_edge(clock_120Mhz) then
init_bus(bus_from_top);
connect_data_to_address(bus_from_communications, bus_from_top, 513, read_address);
create_pixel_image_plotter(pixel_image_plotter, lcd_driver_in, lcd_driver_out);
------------------------------------------------------------------------
if ram_read_is_requested(ram_read_port) then
ram_read_port.read_buffer <= test_ram(get_ram_read_address(ram_read_port));
end if;
if write_to_ram_is_requested(ram_write_port) then
test_ram(ram_write_port.write_address) <= ram_write_port.write_buffer;
end if;
------------------------------------------------------------------------
if data_is_requested_from_address(bus_from_communications, 512) then
request_data_from_ram(ram_read_port, read_address);
read_address <= read_address + 1;
uart_requested <= true;
end if;
if uart_requested then
if ram_read_is_ready(ram_read_port) then
write_data_to_address(bus_from_top, 0, get_ram_data(ram_read_port));
uart_requested <= false;
end if;
end if;
if data_is_requested_from_address(bus_from_communications, 10e3) then
request_image(pixel_image_plotter);
end if;
------------------------------------------------------------------------
end if; --rising_edge
end process test_communications;
------------------------------------------------------------------------
combine_buses : process(clock_120Mhz)
begin
if rising_edge(clock_120Mhz) then
bus_to_communications <= bus_from_top and bus_from_lcd_driver;
end if; --rising_edge
end process combine_buses;
------------------------------------------------------------------------
u_communications : entity work.fpga_communications
port map(clock_120Mhz, uart_rx, uart_tx, bus_to_communications, bus_from_communications);
------------------------------------------------------------------------
u_lcd_driver : entity work.lcd_driver_w_bus
generic map(1199)
port map(clock_120Mhz, lcd_driver_in, lcd_driver_out, bus_from_communications, bus_from_lcd_driver);
------------------------------------------------------------------------
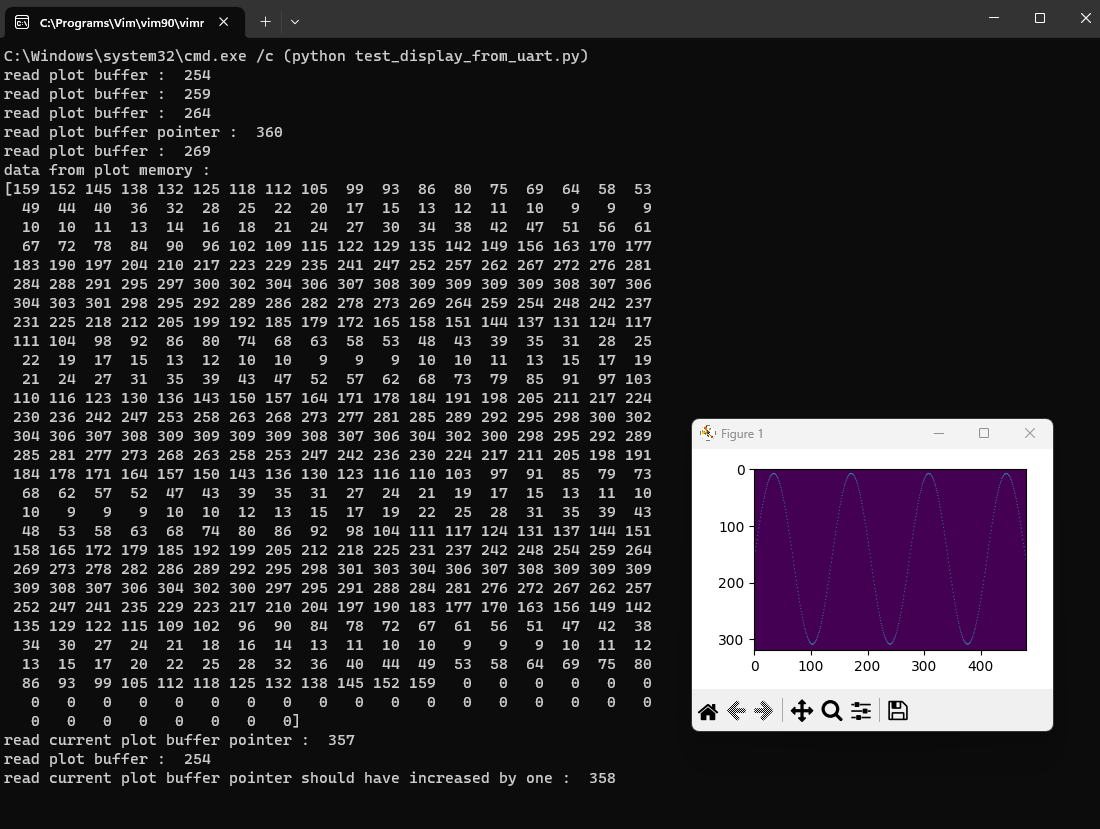
end rtl;The synthesized design is tested using a test_display_from_uart python script. The script reads a few registers from the ram as well as streams the entire ram contents to the console. The script triggers the image formation from the ram and plots the resulting image with the stream_lcd python function. The picture from the fpga is obtained by requesting a stream which length corresponds with the number of pixels in the lcd display.
uart.request_fpga_controlled_data_stream_from_address(10000, 320*480)

xsize = 480
ysize = 320

d = np.zeros([ysize,xsize])
d = uart.get_streamed_data(320*480)

lcd_plotter.stream_lcd(d);
The uart data is captured to an array, hence we can use the plot function directly from the get_data_stream function.
Running the test_display_from_uart.py script additionally tests register reads and writes and streames the measurement points from ram to the console
This data is already in the proper format so now what we need to do is to to drive the lcd screen through the actual display SPI which we will explore in the next post.
Some notes on the design
During the design here, I tried to consciously maximize the reuse of the created source code. There was some amount of duplication, for example the procedure to write text files and the sine plot that were just copied around. During our testing so far we needed 2 different implementations to the lcd driver, one for mocking the interface entirely and another to connect the lcd driver interface to the internal bus and these also had some lines of code just copied from the testbenches.
Since I have the tests in place, moving the duplicate code from the architectures and testbences into packages can be safely done since the code can be run in small batches. So the code can be later easily moved to procedures and packages and hence duplication can be reduced further.
I also used records and procedures to create small design units outside of entities. Creating such small modules allows us to reuse our old code in the intermediate steps when we are creating more complex features. As was discussed in earlier blog post about managing dependencies smaller modules are easier to test, debug and reuse and faster to design. These smaller modules can also be easily connected together using function and procedure calls instead of wiring them with signal through entities.
All of these modules also have their dedicated interfaces that were created with records and subroutines. When we have these interfaces, we can quite easily arrange our modules in multiple different ways. In the design here I used the pixel counter interface directly to write a file as well as a small part of the pixel_image_plotter. The lcd driver was also mocked to write a file as well as act a communication node for internal bus which is connected to uart. Designing this way also helps reuse of the code as the same functionality is already used multiple times during our design process.
The use of these kind of small modules is what allows us to keep making very small steps throughout even a complex design to further test and refine our design. This also greatly reduces duplication and overall verbosity of the code. For example the pixel_image_plotter, though the most complex of the used modules, has the least amount of code. At the time of writing this the module has 79 lines , and with those lines it initializes both ram and lcd driver creates the pixel position counter as well as creates the picture and transmits pixel information to the lcd all of which is automatically timed by the lcd driver module.
Since Efinix now gives free access to their tool, you can download the newest version of the tool from efinix website and build the design by opening the projects xml file with Efinity IDE. The resulting project uses less than 1000 lookup tables at this point hence you can build it using any other vendor tools if you want to run the code on your own FPGA board. The up to date source list needed for building the design can be found in the lcd test projects .xml file. You can use a similar way to configure an additional tool specific top module if you use any other tool than Efinity to build that is used in the hVHDL example project. See the ecp5_build, quartus_build and spartan_7 build folders for lattice diamond, intel quartus or Xilinx vivado build scripts.